类别:源码工具
日期:2022-02-03 浏览:2355 评论:0
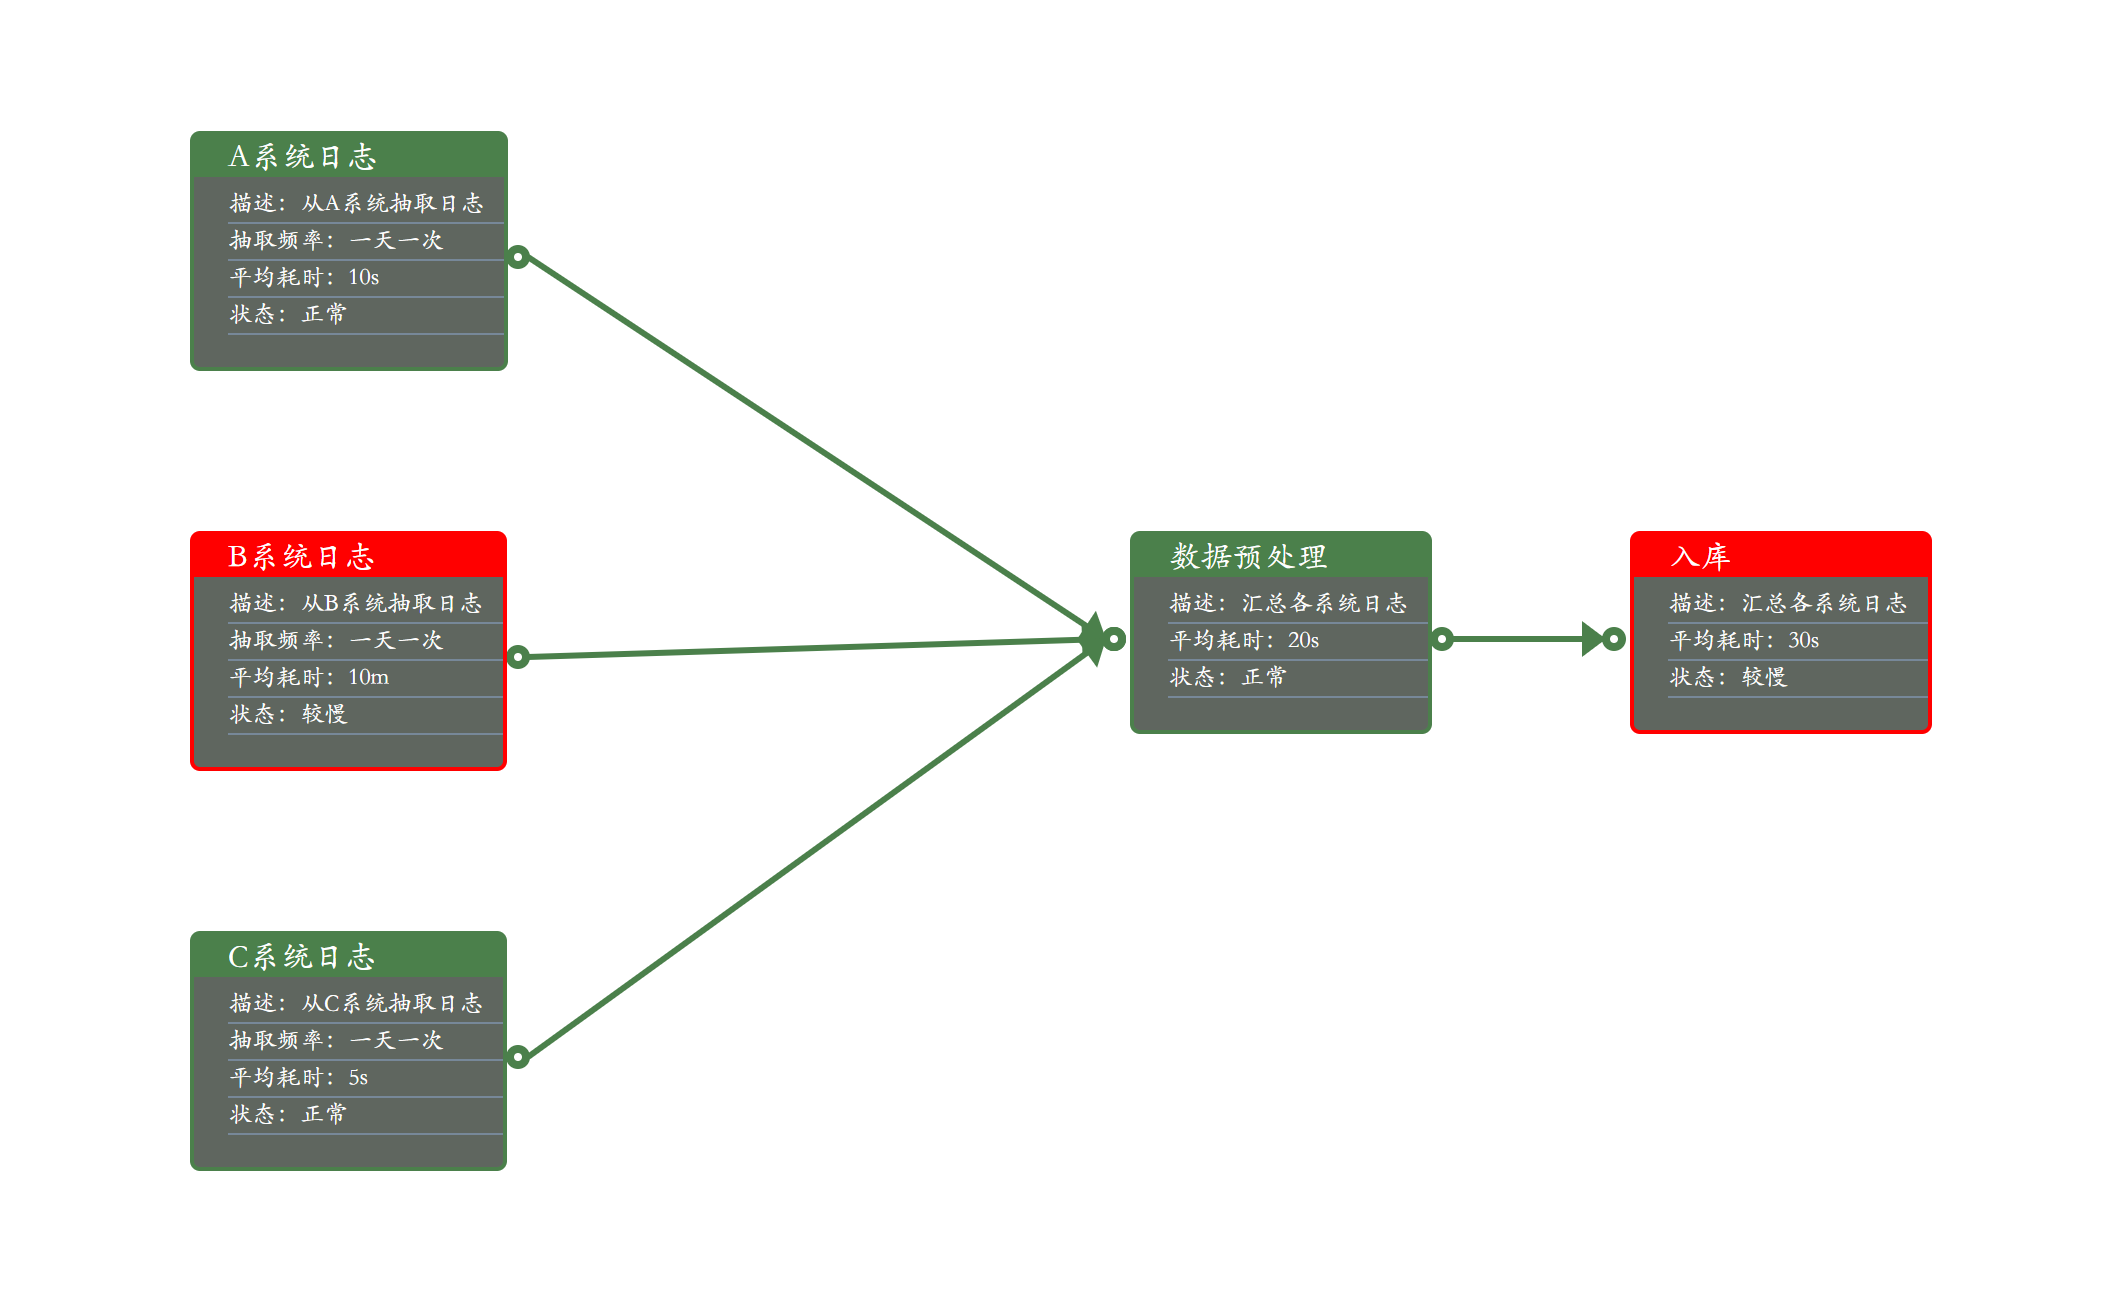
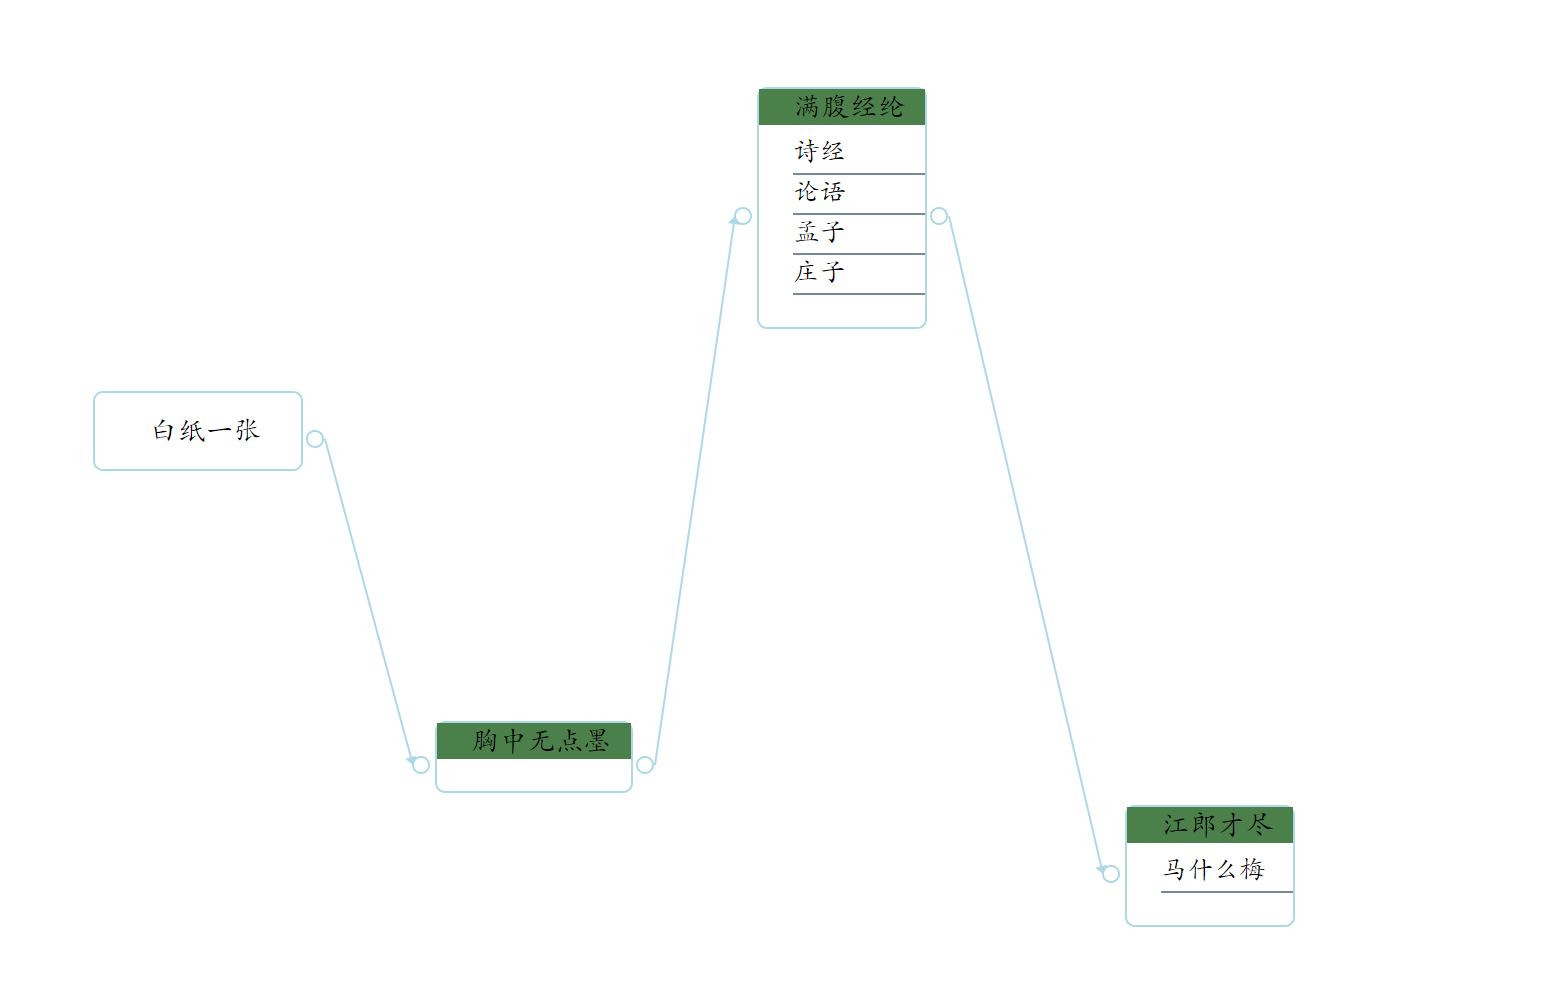
MetricFlow是一个前端画图的javascript库,可用于构建可拖拽、可灵活定义的数据流图、任务流图、知识图谱展示等
展示

文档
快速上手
1. 创建画布
创建画布只需要定义div标签即可,并声明画布的width和height
<div id="graph" height="700px" width="1100px" ></div>
2. 创建节点
/*在画布上创建图*/
let metricFlow = MetricFlow("graph")
/*定义节点数据*/
let nodeData= {
    "id":"primaryKey",//id在全局中不能重复,否则会被覆盖
    "title":{'name':"运行时间统计"},
    "data":[
           {'name':'方法:IndexController#method1'},
           {'name':'平均耗时:0.333ms'},
     ]
};
/*在(20,200)坐标上创建一个节点*/
let node1 = metricFlow.createNode(nodeData,10,200);
/*或者直接在nodeData中定义位置x和y属性,然后*/
/*metricFlow.createNode(nodeData);*/3. 创建连线
let metricFlow = MetricFlow("graph");
let node1Data= {
    "x":10,
    "y":200,
    "id":"node1",
    "title":{'name':"运行时间统计"},
    "data":[
           {'name':'方法:IndexController#method1'},
           {'name':'平均耗时:0.333ms'},
     ]
 };
 let node1 = metricFlow.createNode(node1Data);
 let node2Data= {
     "x":300,
     "y":200,
     "id":"node2",
     "title":{'name':"运行时间统计"},
     "data":[
            {'name':'方法:IndexController#method1'},
            {'name':'平均耗时:0.333ms'},
      ]
  };
  let node2 = metricFlow.createNode(node2Data);
  /*连接两个节点*/
metricFlow.createLink(node1,node2);或者直接在末尾节点中指定from属性,无需metricFlow.createLink(node1,node2);
let metricFlow = MetricFlow("graph");
let node1Data= {
    "x":10,
    "y":200,
    "id":"node1",
    "title":{'name':"运行时间统计"},
    "data":[]
 };
let node1 = metricFlow.createNode(node1Data);
let node2Data= {
    "x":300,
    "y":200,
    "id":"node2",
    "from":"node1",
    //from的值可以是string 也可以是数组
    "title":{'name':"运行时间统计"},
    "data":[]
};
let node2 = metricFlow.createNode(node2Data);4. 批量创建节点
批量创建节点有两种方式,第一种使用list创建,并在每个节点数据中指定from属性即可创建关系:
let metricFlow = MetricFlow("graph")
/*定义节点数据*/
let node1Data= {
        "x":20,
        "y":200,
        "id":"node1",
        "title":{'name':"节点1"}
};
let node2Data= {
       "x":300,
       "y":50,
       "id":"node2",
       "from":"node1",
       "title":{'name':"节点2"}
};
let node3Data= {
       "x":300,
       "y":300,
       "id":"node3",
       "from":"node1",
       "title":{'name':"节点3"}
};
let nodes = [node1Data,node2Data,node3Data];
metricFlow.createNodes(nodes);第二种使用children属性创建,根节点的x和y需指定,其余子节点会自动向右排列
let nodes= {
            "x":20,
            "y":200,
            ...
            "children":[
            {
                   "id":"node3",
                     ...
                   "children":[
                   {...}
                   ]
             },
             ]
     };
metricFlow.createNodes(nodes);
自动创建的时候如果节点间距不合适,可调整
let options = {
               'node-distance-offsetx':5,//左右间距+5
               'node-distance-offsety':-5//上下间距-5
               };
 let metricFlow = MetricFlow("graph",options)
自动创建的时候如果数据格式不匹配,又不想遍历处理,可传入函数调整
function format(data){
    data['value'] = data['value']+"ms";
    return data;
    }
metricFlow.createNodes(nodes,format);样式定义
1. 更改节点样式
节点由三部分组成,分别是 标题、元素集和剩余的背景,每一个部分都支持两种样式定义方式:
第一种是沿用了css的样式,在数据上添加style即可,如,更改整个节点的边框颜色和粗细:
let node2Data= {
    "id":"node2",
    "style":"border-color:red;border-width:2px;",
    "title":{'name':"运行时间统计"},
    "data":[       {
        'name':'方法:IndexController#method1'},
        {'name':'平均耗时:0.333ms'},
    ]
};第二种是提取了background-color和border-color两个样式,可以单独配置
let node2Data= {
    "id":"node2",
    "background-color":"red",
    "border-color":"red",
    "title":{'name':"运行时间统计"},
    "data":[
        {'name':'方法:IndexController#method1'},
        {'name':'平均耗时:0.333ms'},
    ]
};2. 更改标题样式
let node2Data= {
    "id":"node2",
    "title":{'name':"运行时间统计",
    "style":"background-color:red;border-color:red;font-size:15px;"},
    "data":[
           {'name':'方法:IndexController#method1'},
           {'name':'平均耗时:0.333ms'},
     ]
};3. 更改元素样式
let node2Data= {
    "id":"node2",
    "title":{'name':"运行时间统计"},
    "data":[
           {'name':'方法:IndexController#method1',"style":"font-size:10px;"},
           {'name':'平均耗时:0.333ms',"style":"font-size:10px;"},
     ]
};连线配置
连线位置目前仅支持偏移量定义,可在创建MetricFlow时定义
连线分为起始点和终点,可设置全局的起始点的偏移位置,主要考虑前端框架使用较为复杂时css冲突所导致位置偏移的校正
let options = {
                'link-start-offsetx':1,//起始点向右偏移一个单位
                'link-start-offsety':-1,//起始点向上偏移一个单位
                'link-end-offsetx':-1,
                'link-end-offsety':-1,
                'link-width-offset':-1,//线段粗细减小1个单位
                'link-color':"blue", //更改线段颜色
};
let metricFlow = MetricFlow("graph",options)节点事件
支持基本的鼠标事件,如click、dblclick、mousedown、mouseup等,与原生js一致,事件在对应节点身上配置即可:
let node1Data= {
           "id":"primaryKey",
           "title":{'name':"双击"},
           'click':"sinclick", //单击 sinclick为函数名
           'dblclick':"doubleClick",//双击
           "data":[
                  {'name':'方法:IndexController#method1'},
                  {'name':'平均耗时:0.333ms'},
            ]
};下载地址:metricflow.js


发表评论 / 取消回复